
Through the first six months of 2012 the Southern Poverty Law Center (SPLC) has recorded 247 hate crime incidents reported by news media in the United States.* If that rate holds steady for the rest of the year it will represent a 56% increase over the 316 incidents that it cataloged in 2012 2011. Of course, 2012 is a presidential election year, and we would thus anticipate a substantial uptick in such events (throughout the world elections are positively associated with increased violence; e.g., see Richards & Gelleny; Rapoport & Weinberg; and Chenoweth). In 2008 the SPLC recorded 501 incidents, so 2012 is shaping up to look almost precisely like the last year in which we had a presidential election in the US.
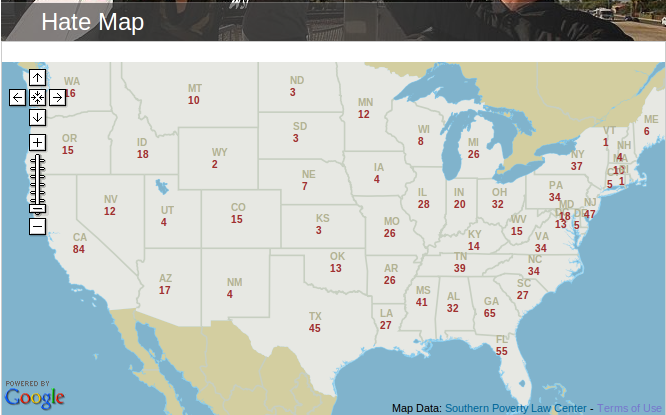
The map above depicts the number of known active hate groups in each state in the US. Clicking on it will take you to the SPLC website where you can drill down to the specific locations of various groups. While the map does not depict change over time, it turns out that there has been a considerable increase in the number of hate groups in the US. In their March, 2012 report “As Election Season Heats Up, Hate Groups at Record Levels” the SPLC writes:
The American radical right grew explosively in 2011, a third consecutive year of extraordinary growth that has swelled the ranks of extremist groups to record levels… “The dramatic expansion of the radical right is the result of our country’s changing racial demographics, the increased pace of globalization, and our economic woes”
We observe similar trends in Europe (e.g., see p. 432 of the May 8, 2009 issue of CQ Researcher, which is of general interest).
In an unpublished 2009 study Richard Fording and John Cotter examine the increase in white supremacy groups by studying both individual and county level data. They conclude that:
The election of blacks has likely fueled an increase in group consciousness among the most prejudiced whites, thus contributing to a proliferation of hate groups across the country.
In sociology the idea that an increase in power and status among subordinate groups generates a backlash among some members of privileged groups is known as the threat hypothesis. A “defensive mobilization” (aka conservative mobilization) literature has grown up around the threat hypothesis, and the Fording & Cotter finding is but one of many that support the theory that as the superordinate power/privilege/status of white Americans continues to decline toward equality a small percentage, but large number, of whites will band together and form groups that attempt to defend the status quo (or, more properly, a romanticized ideal of a status quo ante). More specifically, those at greatest risk to defensive mobilization are those whose earning potential is eroded by the reduction of discrimination in labor markets. Economic recession compounds mechanization processes that replace unskilled laborers with machines, and there is a well documented tendency for threatened groups of white unskilled laborers to respond with violence against minority groups (e.g., Olzak; McVeigh). So the rise in both hate groups and incidents that the SPLC documents is not surprising, and academic research strongly supports the explanation they provided in their March report.
What might we expect over the coming decades? Because “the non-Hispanic white share of the U.S. total population will likely fall below 50 percent by 2050,” in 2011 the Kennan Institute identified the browning of America as the second of its six most disruptive demographic trends. I, for one, have been surprised at the limited violent challenges to the American political system by white supremacy groups. For over a decade I have held the opinion that as its privilege declines white America has one last mobilization/rebellion cycle in it before ceding its numeric advantage. Economic recession, shrinking unskilled jobs, and an election year substantially increase the likelihood of this occuring, but thus far activities have been limited to small groups that engage in actions with low levels of violence. We’ll see what the rest of the summer and fall bring.
* The SPLC provides the following note about their hate crime incident data: “Incidents of apparent hate crimes and hate group activities listed here are drawn primarily from media sources. These incidents include only a fraction of the approximately 191,000 reported and unreported hate crimes that a 2005 government report estimated occur annually.”
@WilHMoo


0 comments
Will. Cool Post. A couple of pieces of info that might be related. Last year, I did some interviews with some activists among these groups and they preferred to be called “White Nationalists” or “White Separatists” as many have given up the notion that the entire US will be whites only. Instead some feel a 10% solution or a portion (10%, mostly northwest states, Idaho, etc.) of the US should be Whites only.
Also, many feel that the post 9/11 environment is not conducive to militant activism and they have focused on attaining political power (mayors, local reps, etc.). The recently murdered head of the NSM, Jeff Hall, for example, ran for a local water board and got nearly 1/3 of the vote.
Here is a link to a nice article written about a year ago which documents the electoral strategy that Joseph mentioned. The leader of America’s Third Position, which is the mainstream electoral face of the movement is a guy named Tom Sunic. He is actually a political scientist with a Ph.D. from one of the UC campuses. He actually tried to get me to invite him to speak here on our campus last fall. I had no idea at the time who he was.
http://www.thedailybeast.com/articles/2011/07/04/white-supremacists-running-for-political-office-in-2012-in-growing-numbers.html
The problem with numbers from the Southern Poverty Law Center is that they are inherently flawed from the outset.
There is no legal definition for “hate group,” which is why even the FBI does not, cannot, designate “hate groups,” but somehow a private fundraising organization can?
Everyone has their own definition of what a “hate group” should be, but without a legal, codified definition the term “hate group” means whatever the user says it means and that’s not good enough.
The SPLC has no more authority to designate “hate groups” than does the SPCA.
You’ve cited two of the SPLC’s primary fundraising tools, the Hate Map™ and the list of hate “incidents,” which you’ve misidentified as hate “crime” incidents, which the vast majority are not. A closer look at the numbers quickly illustrates the spurious nature of the data.
Of the 1,018 “hate groups” designated by the SPLC’s public relations chief, Mark Potok, fully 247 of them are no affiliated with any known city or town. Mr. Potok cannot locate these alleged groups on any map, including his own.
That’s 25% of the total right off the top.
You’ve noted that the Hate Map™ is interactive and that users can click on a given state to see the “hate groups” located there. The state of Georgia is a perfect example.
In March of 2011 Mr. Potok added 20 chapters of something he calls “the Georgia Militia” to that state’s map, but he cannot locate 18 of them. They simply float out there in limbo, padding the numbers.
See it for yourselves:
http://www.splcenter.org/get-informed/hate-map#s=GA
There are 18 blank slots marked “Georgia Militia.” THIS is hard data?
In many states the percentage of homeless “hate groups” runs as high as 60%, 80% and even an incredible 100%.
http://wp.me/pCLYZ-ce
You mention the 247 “hate incidents” to date listed on the SPLC website, but again, if you actually look at the numbers you see they really don’t add up.
First of all, “hate incidents” are not “hate crimes” and Mr. Potok admits, as you mention in your footnote, that his numbers come from newspaper reports and the SPLC does no investigation of its own.
At the top of the incident list is a link to a downloadable spreadsheet describing each incident. If you you download it and sort it by incident category you find that the largest single category is described as “Legal Developments.”
Legal developments refer to events that have transpired AFTER an incident, often YEARS after the incident.
For example, on 1/21/12, Daniels Enders and Nicolas Comis, of Bass River, NJ, pled guilty to bias intimidation for burning a cross near a black family’s residence in February 2011.
How can this possibly be considered a “hate incident” when the actual intimidation took place nearly a year earlier? How is pleading in court a “hate incident”? Why should this be counted as an incident in 2012?
But wait, there’s more…
On 6/27/12, Comis and Enders were sentenced to 270 days and 180 days in prison respectively for burning that cross near a black family’s residence in 2011.
That’s TWO “hate incidents” for 2012 based on events from 2011, and if nothing else, they prove that the system works.
There are 108 “legal developments” on the 2012 list, or 38% of the total. In 2011, 112 of the 312 “incidents” listed were legal developments. That’s one out of three!
What do these bogus numbers do to your extrapolation that predicts a record year of hate crimes?
http://wp.me/pCLYZ-bs
I apologize for the length of this post, but so many people are taken in by SPLC fundraising propaganda that I feel compelled to expose it whenever I can.
I don’t expect anyone to take my word for it. Every single fact I’ve cited comes from the very sources you cite on the SPLC’s own web site. All I ask is that people simply look at the numbers themselves and decide for themselves whether or not the numbers are accurate.
These bogus numbers are the number one factor accounting for the fact that the SPLC currently takes in more than $106,000 donor dollars a day. That’s more than $4,400 an hour and does not include the tens of millions of tax free interest generated by their quarter-billion dollar endowment fund.
http://wp.me/pCLYZ-d3
The SPLC has an extremely compelling financial stake in playing fast and loose with “hate” numbers.
Reblogged this on Faktensucher.
The political places in the government, that before 1963, Use to be a good job for well studied fine people, those jobs, are for persons, that they don’t wish to lie, or to do any Cain of crimes, those job are to help to the public, but after the 1963 year, those places became a full time work, for nasty criminals assassins thieves,