Guest Post by Brian Phillips for Denver Dialogues
The Texas church mass shooting that killed 26 people and wounded around 20 others has people asking if anything can deter such horror.
One policy mentioned by gun-control proponents is an assault weapons ban. Could such a policy affect mass shootings?
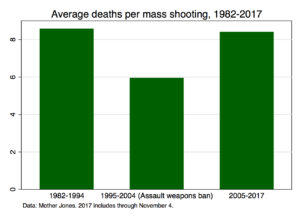
A look at the numbers, while preliminary, suggests that U.S. mass shooters hit fewer people and killed fewer people during the 1994-2004 assault weapons ban than before it or after.
The assault weapons ban restricted certain semiautomatic firearms, and magazines that hold more than 10 bullets, whether they are for rifles or handguns. The ban on high-capacity handgun magazines is relevant for mass shootings because most mass shooters use handguns.
Several studies have shown that the assault weapons ban did not seem to affect general violence, such as homicide rates. However, the price of high-capacity pistol magazines increased during the ban. Also, the share of assault weapons used in gun crimes decreased in cities such as Baltimore and St. Louis after the ban went into effect. Other research found that the expiration of the ban was associated with increased violence in Mexico near the U.S. border – but not in areas bordering California, which maintained its own assault weapons ban.
What about mass shootings? Mass shootings cause a small percent of U.S. homicides, but they are so shocking – and many are literally terrorism – that they are worth trying to understand.
One analysis suggests that the number of mass shootings declined slightly during the years of the assault weapons ban. But beyond the number of shootings, there are other outcomes worth examining. Some mass shootings kill five or six people, while others kill dozens. The factors that make mass shootings likely might be different from the factors that affect the lethality of mass shootings.
Using the widely-cited Mother Jones data on U.S. mass shootings, I found some interesting trends. Mother Jones originally defined a mass shooting as a single attack in a public place in which four or more victims were killed. However, because of a change in federal standards, starting in 2012 they include shootings where three or more victims were killed. (This might lead to the finding that mass shootings in 2012 and beyond were less lethal on average, since the bar was lowered for inclusion.)
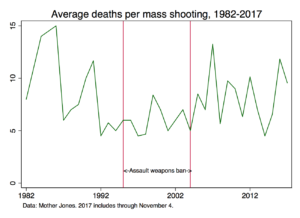
The above graphic shows fatalities per shooting, per year. These are not total mass shooting deaths per year, but the total mass shooting deaths of the year divided by the number of mass shootings that year. Vertical red lines mark 1995 and 2004, the first full year the ban was in effect and the last year when it was in effect for most of the year. (The ban was law from Sept. 13, 1994, to Sept. 13, 2004.)
Mass shootings were generally less lethal during the ban.

Mass shootings killed two to three fewer people during the assault weapons ban than they did before or after it.
The symmetry of death rates pre-ban and post-ban is remarkable.
A few mass shootings in the database were perpetrated by two shooters together. We shouldn’t expect a solo shooter to kill as many people as a team, and indeed, graphs of fatalities per mass shooter, instead of per mass shooting, look similar to those above.
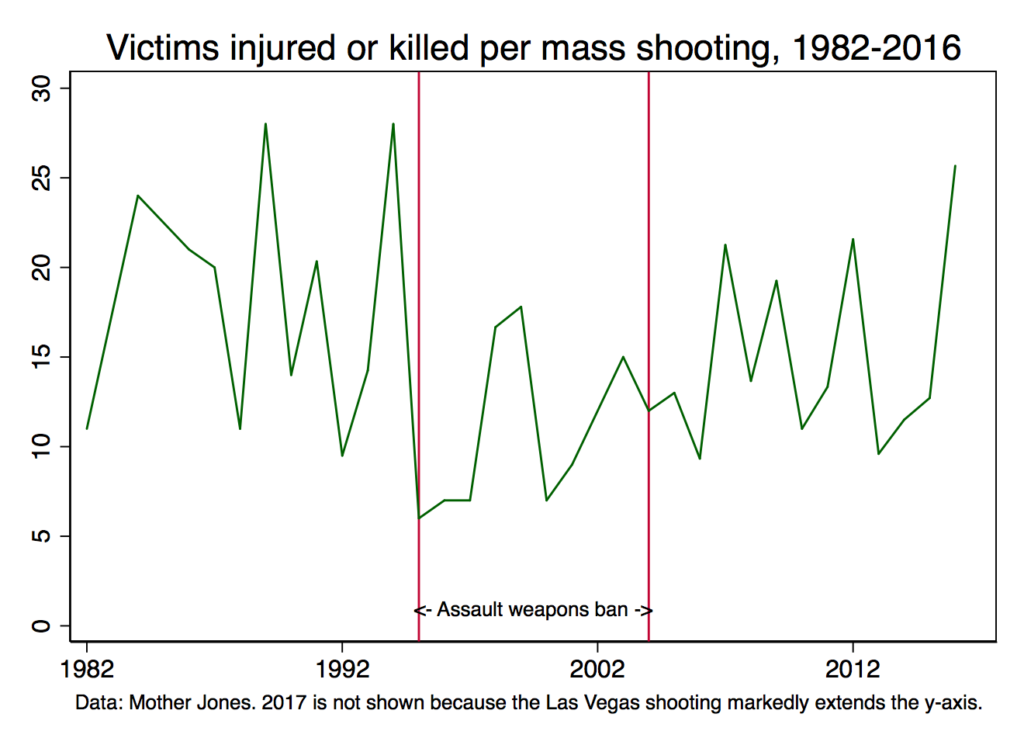
The average mass shooter killed or injured more than 18 people before 1995, and more than 19 people in the years after 2004. However, during the years of the assault weapons ban, the typical mass shooter killed or injured fewer than 11 people.
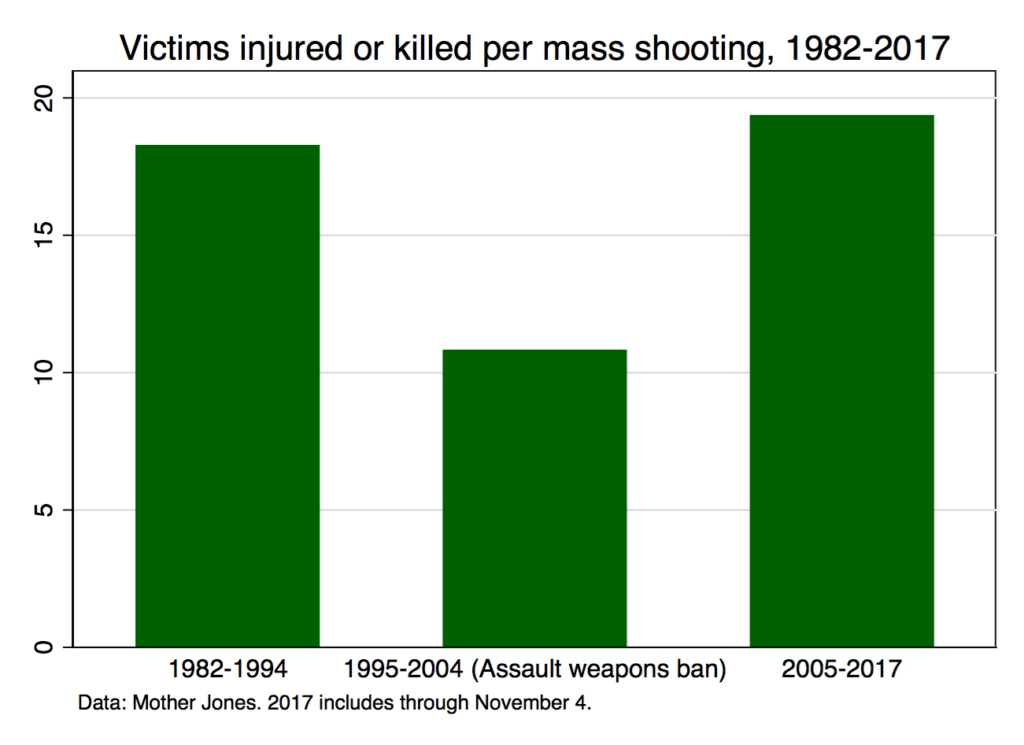
On average, mass shootings during the assault weapons ban victimized fewer people, and killed fewer people, then they did before or after it. Was this because high-capacity magazines and so-called assault weapons were harder to obtain? It does seem possible that when tools that facilitate shooting large quantities of bullets are more widely available, mass shooters would hit and kill more people.
Other research has found that firearm type is related to casualty rates. An analysis of mass shootings in the 1990s found that those involving assault weapons killed 6 people on average, while mass shootings with other types of firearms killed about 4.5 people. Another study found that handgun shootings involving semiautomatic pistols tend to result in more bullets fired, and 15% more people injured, compared to shootings involving non-semiautomatics (revolvers).
Did the assault weapons ban cause death and casualty rates to decline, or is it a coincidence? What other factors would explain the difference in rates before and after the ban?
This is a simple analysis of the data, looking at averages, and not taking into consideration alternative explanations. Hopefully additional research can shed light on these important questions.
Brian J. Phillips works on security issues at the Center for Research and Teaching in Economics (CIDE) in Mexico City.





4 comments
Show us confidence intervals, please.
Nice piece, Brian. For your and your reader’s interest, I replicated your analysis and included a statistical analysis of the effect of the assault weapons ban on three measures of ‘mass killings’ using this dataset. Initial tests support an effect for the weapons ban on not just average deaths per event, but also total deaths per year and number of events per year. For more info: https://s3.wp.wsu.edu/uploads/sites/1289/2017/11/GunViolenceRevisited.pdf
Anthony, thanks! This is great. Two quick notes: First, it’s really weird that the table I made in Stata doesn’t show the zeros. They are in the data, and they’re reflected in the averages (so, in the bar graphs for example). But for some reason they’re ignored or treated as missing in the graph. I will keep an eye out for that in the future. Second, the regression results are cool. Also, it was pointed out to me recently that someone did do a brief paper, a research note, on the Mother Jones data from 1982-2011 and also finds support for an effect of the ban. http://www.tandfonline.com/doi/abs/10.1080/13504851.2014.939367 He finds results similar to yours. However, it has ALSO been pointed out to me (lots of pointing out going on :)) that maybe a negative binomial is better than a poisson, and the results are not as strong there, if at all. So there’s certainly more work to be done… But I was really glad to see your paper.
Very interesting, Brian, and thanks for the follow up! That is odd about the zero-years in the data. I took a look at the 2014 paper you cited – similar results indeed, and with some of the relevant control variables, which is great. The problem with modeling count data is that the DV often violates the equidispersion assumption for Poisson regression, but I have found some disagreement about whether quasi-Poisson or negative binomial regression is ideal, especially since both models correct for overdispersion. Guis 2015 seems to have taken the classic Poisson approach in his paper, while Duwe et al. 2002 (who Guis cites) use a negative binomial, but they seem to choose this model solely due to overdispersion, begging the question of why not quasi-poisson? Anyway, seems the jury is still out on the modeling question (http://fisher.utstat.toronto.edu/reid/sta2201s/QUASI-POISSON.pdf) but it was interesting that we are finding effects on assault weapons regulation but not so much on regulations of other firearms.